22 claps
Employee turnover costs far more than a replacement salary. Here's how to calculate the true number and build a retention business case your board will approve.

This page didn't load correctly. Please check your connection and try again.
Employee turnover costs far more than a replacement salary. Here's how to calculate the true number and build a retention business case your board will approve.
The cost of employee turnover is far higher than the salary you pay to replace someone. When a good employee walks out the door, you lose institutional knowledge, team momentum, and months of productivity — and you start paying to source, screen, hire, and onboard a replacement who won't reach full speed for the better part of a year.
For a CFO, turnover isn't an HR line item. It's a recurring, largely hidden drain on margin that rarely shows up cleanly on a single budget. This guide breaks the number down the way finance actually thinks about it — what turnover really costs, how to calculate it for your own organisation, and why the highest-ROI fix isn't another pay rise.
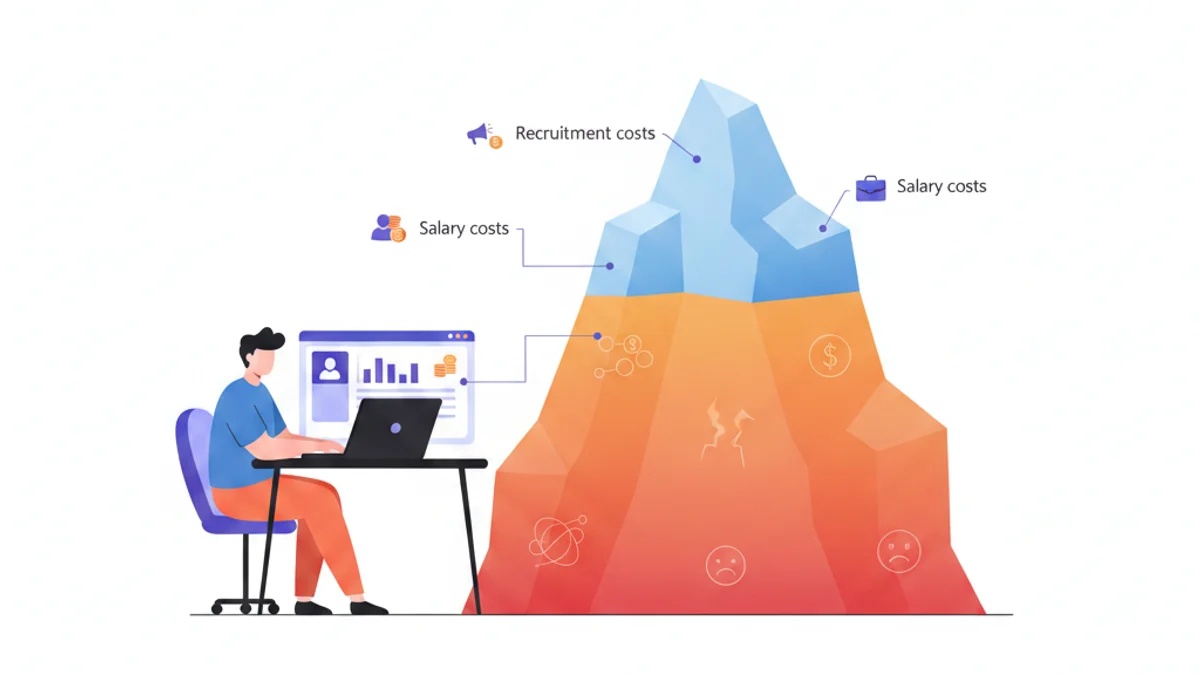
The true cost of employee turnover is the sum of three things: what you spend to replace the person, what you lose while the seat is empty or half-productive, and what walks out with them. Most turnover budgets only capture the first.
Let's define it plainly. Employee turnover cost is the total financial impact of an employee leaving and being replaced — from the recruiter's time to the ramp-up months when the new hire isn't yet delivering full value.
Here's why the headline number is almost always understated. The invoice from a job board is easy to see. The eight weeks a manager spends interviewing instead of managing, the deals a departing salesperson took with them, the team that quietly started looking because their favourite colleague left — none of that hits a purchase order.
Advertising, agency fees, recruiter hours, assessments, background checks, onboarding, and training. Visible, invoiced, and the easiest to cut — but rarely the biggest slice.
The vacancy gap plus the ramp curve. A new hire typically reaches full productivity in eight to twelve months, and the team absorbs the overflow in the meantime — often at the cost of their own output.
Institutional memory, client relationships, and team cohesion leave with the person. Turnover is also contagious — one departure often triggers others, compounding the cost.
The benchmarks are sobering, and they're consistent across the major sources. Replacing an employee lands somewhere between half and double their salary — and for senior or specialised roles, it climbs well past that.
Annual salary to replace one employee
Gallup
Annual cost of voluntary turnover to U.S. business
Gallup
Of turnover is preventable by employers
Work Institute Retention Report
According to the Society for Human Resource Management (SHRM), the average direct cost per hire sits around $4,700 — but SHRM also notes that when you fold in soft costs, total replacement can reach 50% to 200% of the departing employee's annual salary depending on seniority.
The Work Institute's Retention Report puts the sharpest point on it: the large majority of departures were preventable, and employees most often cited career development, management, and wellbeing — not pay — as the reason they left. That single finding should reframe how any finance leader thinks about the spend.
You can produce a defensible turnover cost figure in three steps. It won't be perfect — but a directional number your board trusts beats a precise number nobody ever builds.
Divide the number of employees who left during the year by your average headcount, then multiply by 100. Separate voluntary from involuntary departures — voluntary turnover is the number you can most influence.
Example: 60 leavers across an average headcount of 400 = a 15% annual turnover rate.
If you can't build a bottom-up figure yet, use a conservative benchmark: start at 50% of annual salary for frontline roles and scale toward 150–200% for management and specialists (per SHRM and Gallup ranges).
For a role paying €40,000, a conservative 75% multiplier puts the cost per departure at €30,000.
Multiply leavers by cost per departure. In our example: 60 departures × €30,000 = €1.8 million a year — before you count the contagion effect on the colleagues who leave next.
Now model what a 3-point reduction in turnover would return. That delta is your retention business case.
Annual turnover cost = Number of departures × Cost per departure
Where cost per departure = (direct replacement cost) + (lost productivity during vacancy and ramp) + (a knowledge/morale factor). When in doubt, benchmark conservatively and note the assumption — a transparent estimate is more credible to a board than a black-box precise one.
Most retention budgets go to pay rises and one-off perks — and most of that money underperforms. The reason is simple: people rarely leave primarily for money, so paying them more rarely keeps them.
According to LinkedIn's Workplace Learning research, employees who feel their organisation invests in their growth stay markedly longer. Retention, it turns out, is an engagement problem wearing a compensation costume.
A talent community attacks turnover cost from both ends: it keeps current people engaged, and it slashes the replacement cost when someone does leave. Here's how that works in practice.
A talent community is a warm, engaged pool of candidates and alumni who already know your brand — not a cold database of stale CVs. When a seat opens, you're not starting a search from zero. You're re-engaging people who raised their hand.
A warm pipeline cuts time-to-fill and agency spend. Filling from an engaged community can take days, not the 40–60 the market often reports — shrinking the vacancy-gap slice of your turnover cost.
The same engagement mechanics that build a community — content, challenges, recognition — also keep current employees connected, addressing the belonging gap that drives voluntary exits.
Community members experience your culture before they join, so the people who convert are better matched — and better-matched hires are far less likely to become first-year turnover.
Engaged alumni and their networks become a low-cost rehire and referral channel — the cheapest, highest-retention source of talent you have.
Wyndham Hotels shows the mechanics in a high-turnover industry. Facing the relentless churn of multi-site hospitality hiring, Wyndham used Jobful to build an engaged candidate community and drove 290% more applications — converting a constant, expensive scramble into a self-replenishing pipeline. Read how in our customer case studies.
Turn the turnover number into a decision your board can approve. The pitch isn't "spend more on retention" — it's "here's the margin we're currently leaking, and here's the return on plugging it." Frame it in the language finance already uses.
| Board question | What to present |
|---|---|
| What is turnover costing us today? | Your annualised figure from the formula above, split into direct, productivity, and knowledge costs. |
| How much is preventable? | Apply the Work Institute's ~77% preventable finding to your voluntary turnover to size the addressable pool. |
| What is the expected return? | Model the savings from a realistic 2–3 point drop in voluntary turnover against the cost of the retention programme. |
| How will we measure it? | Voluntary turnover rate, first-year attrition, time-to-fill, and engagement scores — reviewed quarterly. |
| Why now? | Every quarter of inaction repeats the leak. The cost of doing nothing is the number you just presented. |
Pair this with our related reading on the cost of vacancy and the cost of a bad hire to give your board the full picture of what hiring friction is costing the business. The three numbers together are hard to ignore.
See how a Jobful talent community keeps your people engaged and cuts the cost of every departure — with a warm pipeline ready before the seat opens.
Join 5,000+ HR professionals receiving monthly insights.